Vera and Donald Blinken Open Society Archives
If Polls Are so Wrong about US Elections (as You Think They Are), then Are They Good for Anything at All?
I have kept getting polite versions of the above question ever since I started talking to colleagues about the exciting prospects of expanding the Vera and Donald Blinken Open Society Archives’ collection of survey data. Joe Biden’s unexpectedly bumpy ride to an Electoral College majority turned this nagging question into a burning issue that may undermine the credibility of much social science research worldwide. Let me address the problem in three steps.
First, I summarize what we know about the accuracy of the 2020 US election polls. Second, I look at the industry’s response to the 2016 polling debacle and why was it not enough. Third, I discuss precisely what is demonstrably going wrong with polling in our time and what we can do about it other than dumping the polls in our historical archives next to all other memorabilia of 20th-century life.
Red mirage or massive polling error?
As Donald Trump was declared winner in Florida in the morning after this year’s elections, doubts arose about the future of polls. These were only reinforced a few days later by how thin the lead of Joe Biden turned out to be in states like Wisconsin. Shocking estimates of unprecedented polling errors started circulating on Twitter. Credible-looking political scientists stepped forward to make false claims about Nate Silver’s predictions and how the repeatedly tested and refuted “shy Trump voter” theory may explain what happened. Pollsters were called to account by the media even in faraway countries like Hungary. Authoritative representatives of American pollsters, however, declined to respond, arguing that the vote count is far from over.
True, states like Alaska, Ohio, Utah, and Washington have their deadlines for the arrival of legitimate mail ballots many days after the election, and, in 2016, California kept counting its gigantic reserves of mostly Democratic votes for so many weeks that the world hardly ever noticed how big Hillary Clinton’s vote share turned out to be at the end. To the pollsters’ and forecasters’ credit, they correctly predicted a red mirage and a blue shift, i.e., that, after the polls close in 2020, the Republican president would cruise to a seeming victory over his Democrat opponent before seeing his advantage decisively overturned in the span of a few days. Academic surveys, too, provided compelling evidence that there would be both an unprecedented number of early and mail ballots to count, and a wide gap in support for Democratic candidates between these votes and those cast on Election Day.
Yet, the public want an informed discussion about the polls now and not in December, when California may complete its count. By then, the audience and the media may make up their mind and lose interest in the topic. In any case, we can already gauge the likely breakdown of the uncounted votes: detailed estimates are available about how many mail, election day, provisional, and overseas ballots are yet to be counted and precisely where.
Only looking at the presidential race here, the most famous of American election modelers expects, on the basis of such a calculus, that Biden will win upwards 4.3% more of the roughly 160 million presidential votes than Donald Trump. That comes eerily close to a prediction that used both polls and other information to model the outcomes. But it is 3-4% away from the 7.2% average lead of Biden in the polls on the day before the election reported in one, or the 8.4% reported in the other most reputable aggregator of this kind of information. This suggests a sizeable and systematic pro-Democratic bias in the 2020 polls; roughly equal or slightly bigger than the 3.1% pro-Democratic bias in 2016 and the 2.5-2.6% pro-Republican bias in 2012 and 2000, and well above the 1.1 pro-Democratic bias in 2004 and 2008. (By bias I mean a difference between the actual breakdown of the vote between candidates and that foreseen in an average of relevant polls.)
Obviously, the national figure masks considerable variation across states. In every election, the polls are spot on in some of the 50 states, and considerably off in others. This is natural, as is the fact that the errors tend to be largest in places where there are few polls—and especially few high-quality polls—because the contest is not close. In the 2016 and the 2018 mid-term elections, for instance, polls of Tennessee fared worst with a nearly 13 and 8% bias, respectively. It is early to tell where polls will prove most off the mark in 2020, but North Dakota seems to be a strong contender. However, once again some of the intensely polled battleground states also saw disturbingly high bias in the average poll. In Wisconsin, the vote count seems nearly complete, and Biden’s lead will likely end up as less than a percent instead of the 6.7 or 8.3% lead suggested by the polling averages.
Clearly, the information provided by the Wisconsin polls was far more inaccurate than implied by the pollsters’ conventional caveats about sampling error. And that error was not exceptional among battleground states. The chart below plots the polling averages reported on a leading forecaster’s page before the election against the votes counted before Monday, November 9. I focus only on the 14 states that seemed the most important for the overall outcome, i.e. the likeliest tipping points in the race for the Electoral College majority either in 2016 or 2020. Both axes display the percentage lead of Biden over Trump. Negative figures signal a Trump advantage in the state.
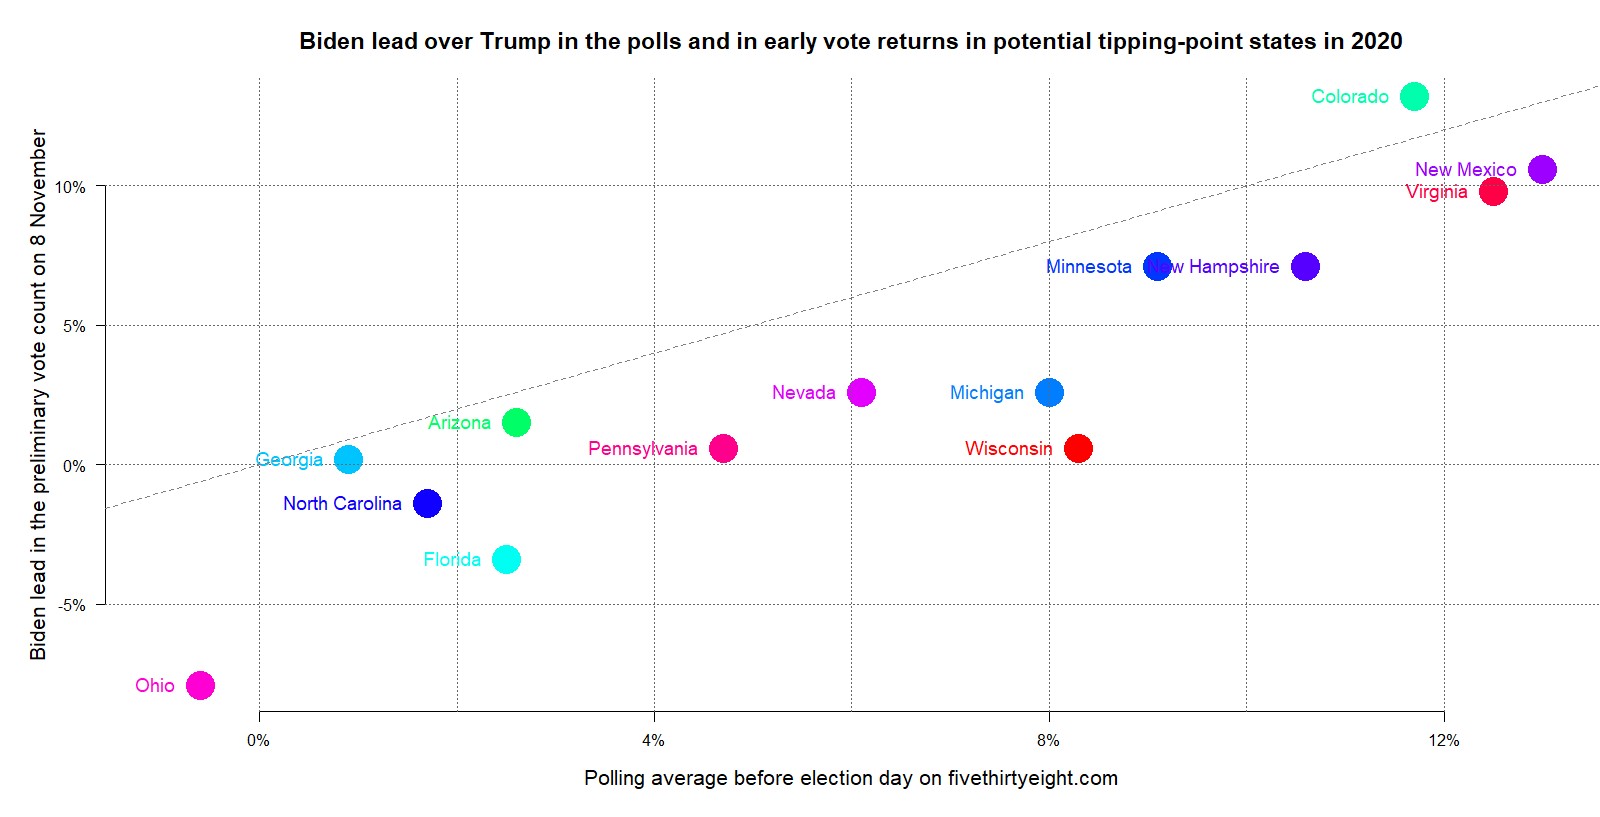
The size of the apparent polling errors may still diminish a percentage or two as the count becomes complete, but Biden was clearly overestimated in most battlegrounds. So far, the polls only seem to have overestimated Trump’s support in Colorado (and in a few less competitive states like California that do not appear in this chart). The polling averages and the preliminary results are strongly correlated at r=0.91 across the 14 states, which means that the polls did show where Biden would do better. But the polls erred in the same direction, and, among battleground states, apparently peaked in some of the same states in 2020 as in 2016. Just note how far Ohio, Michigan, and Wisconsin fall under the dashed diagonal line, which is where states would line up if the polls provided a perfect prediction of preliminary results. That distance signals substantively big errors for potentially pivotal states. This is what was noted by the observers who called into question the industry’s ability to correct recent errors.
Can you make the same error twice?
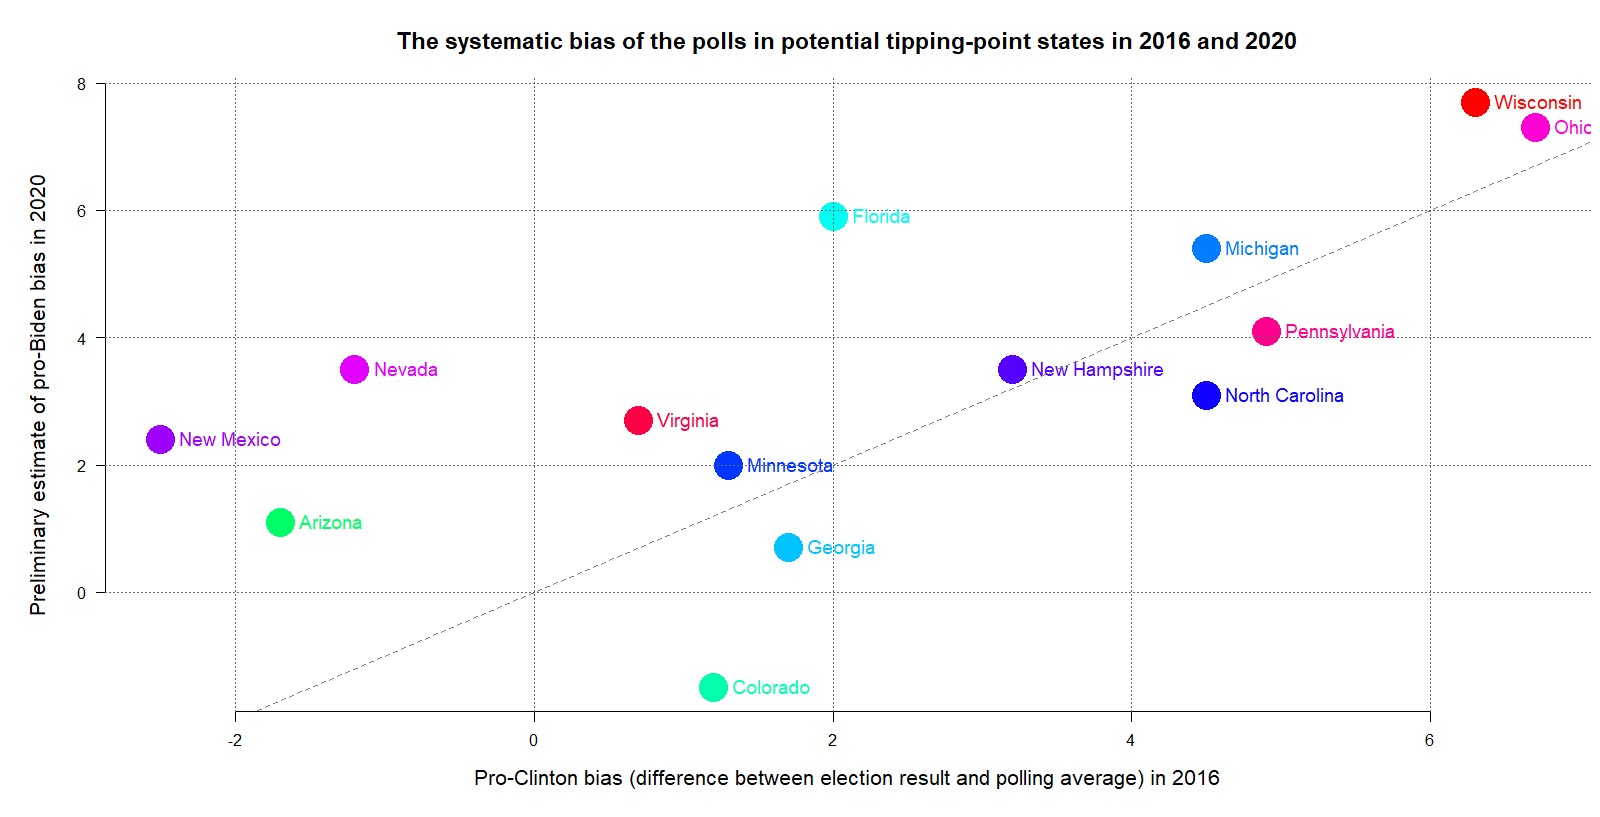
Yes, they can, as the next chart about the continuity of systematic polling errors across the 14 battleground states shows. Here, the vertical axis refers to the difference between the 2020 polling average and the 2020 preliminary results shown in the previous chart. The horizontal axis shows the difference in 2016. Positive values of bias mean that the polling average overestimated, and negative values that it underestimated support for the candidate winning the popular vote nationwide—i.e., Hillary Clinton in 2016 and Joe Biden in 2020—relative to support for the runner-up (Donald Trump in both years). New Hampshire, for instance, sits near the middle of the plot with a value slightly above +3 in either year, because the Democratic candidate’s lead over Donald Trump was overestimated here by just over 3% in both years.
The locations of the battleground states along the two axes are positively correlated at r=0.65, which suggests moderately strong continuity. Pennsylvania, North Carolina, Georgia, and Colorado fall below the dashed diagonal line, which means that the pro-Democratic bias of the polls was smaller in these states in 2020, than in 2016. Sizeable pro-Democratic polling bias emerged in Florida, Nevada, Arizona, and New Mexico, most of which had, in fact, a pro-Republican bias in 2016. Once we disregard these four states that have large Hispanic electorates, the changes in bias seem modest or point in the opposite direction, and largely cancel out each other across the remaining ten states. Thus, we probably see two different patterns here.
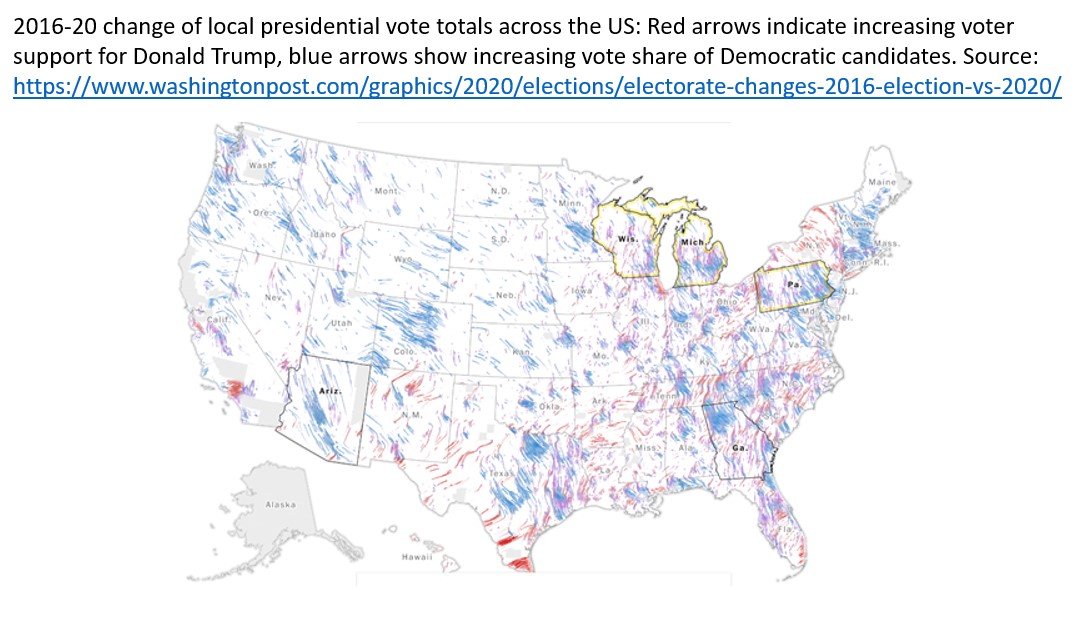
It would be foolish to test any theory with such a quick look at incomplete data. Yet, it is tempting to relate the apparent exceptionalism of the bilingual Sun Belt states to the much talked-about swing to right-wing candidates among Hispanic voters this year. Hispanics used to vote mostly for Democratic candidates. Hence their lower response rate to English-speaking polls could historically bias poll findings in a pro-Republican direction. This was indeed advanced before as an explanation for the persistent underestimation of Democrats in polls in California and Nevada. It was emphasized before this year’s election alongside the underestimation of Republicans in the Midwest as a reason to be prepared for massive polling errors in 2020. If Hispanic voters indeed had a strong swing to the Republicans as the 2020 electoral map suggests—see the concentration of red arrows in Southern Florida, all along the Mexican border from Southern Texas to the Southern tip of California, and parts of Nevada—, then maybe that could explain at least part of the pro-Democratic bias in the polls in the Sun Belt.
But how about the pronounced pro-Democratic bias of the polls in the other potential tipping-point states save Colorado? Those persisted in both 2016 and 2020. Regarding the first, the American Association of Public Opinion Researchers (AAPOR) commissioned a comprehensive post-mortem that also passed peer-review in a scholarly journal. This study meticulously examined various hypotheses for the 2016 debacle, and recommended some remedies. In response, weighting by education and some other measures were implemented by the bulk of the industry since. Weighting itself is not new. Pollsters virtually never count all respondents equally. Some are taken to represent two or three, others just half a person, such that the presumed distribution of sex, age, etc. in the population is precisely reproduced in the data. What criterions one weights for is more art than science, and is led by ever changing ideas about what causes lack of representativity in a sample for a particular purpose. The reason for the new AAPOR recommendation was that the 2016 post-mortem found no support for theories like the “shy Trump voter” (according to this speculation supporters of norm-breaking candidates do not reveal their preferences to interviewers, but 2020 polls also refute this idea, see e.g. here and here.) Instead, the report noticed that with the emergence of Donald Trump, a major partisan gap emerged between more and less educated white voters in the Midwest and elsewhere, which then resulted in an underestimation of Republican support in the polls due to a long-standing underrepresentation of less educated respondents in the samples.
Even if the problem had been fixed since—which was disputed by articles in the New York Times in 2018 and in RealClearPolitics last September—, new problems could emerge in 2020 to generate a pro-Democratic bias in the polls. The sudden rise in the proportion of mail voters is expected to produce a major increase in the number of invalid and late-arriving ballots, and this will mostly annul votes for Democrats; but the polls could not foresee whose vote will count. Alternatively, Donald Trump may have made his gains among politically and socially disengaged voters, who are conspicuously underrepresented in virtually all polls. This was not a problem in the past, when social and political engagement did not differentiate between Republicans and Democrats, but may need attention now. Yet another possibility is that the polls underestimated a trend toward Trump in the last weeks of the campaign. This is quite possible, because live interview surveys over the phone picked up such a trend, while online polls that by now account for 80% (!) of all election polls, missed it. Ann Selzer’s much-adored survey operation observed a much larger swing to Trump in that period, than other polls saw in Iowa, and got the president’s margin of victory in the state right, while the polling average markedly underestimated that. That such a trend occurred in all battleground states is conceivable because the Republican Party kept on doing its highly effective door-to-door, in-person mobilization, while the Democrats decided not to do so this year because of the COVID-19 pandemic.
Why are the errors so big?
Whatever the post-mortems will find out about the precise size and cause of the errors in 2020, there are three uncomfortable news here for the pollsters. First, the errors are bigger than they should be. Second, they are vastly bigger than pollsters led the audience to expect. Third, it is no good excuse to say that they just do polls, and not forecasting. Let’s now discuss these points in a reverse order.
The audience reads polls because they expect forecasts. If the pollsters do not attach predictions to their numbers, the reader will either ignore them or draw their own inferences. At best, they will stop reading the polls, and listen to independent modelers like Nate Silver, RealClearPolitics, the scientist team behind the Economist’s forecast, the New York Times Upshot, and so forth. Modelers average the polls, spare no criticism of them, and add their own interpretation of what can go wrong with the polls and how that possibility should influence our expectations about the outcome of the election. The audience can also put their trust in forecasters who try to amend or replace the information obtained from the trial heat polls with other indicators of the likely outcome (this and this in fact impressed with their precision in 2020, while some that used social media data or econometrics were even more off the mark than the polls.)
The reason why pollsters themselves are not a good source to listen to is that they demonstrably understate the margin of error. In a two-horse race, the eyes are naturally drawn to the difference between the two candidates. Pollsters should anticipate that, and warn that the simple statistical error of that is roughly the double of the error for either of the two candidates. Besides, the simple statistical error that arises because the polls interview a sample instead of the population is about twice as big as the pollsters’ communiques routinely pretend. Some pollsters may not know this, but this much is clear from both statistical theory and analyses of actual election polls. The reason is that survey samples are not simple random samples any more, but complex constructions, and use complicated weighting procedures to adjust for what they believe about who are currently underrepresented in their sample of likely or at least eligible voters. Who is underrepresented changes from election to election, because we can only hope to get an answer from a tiny fraction of the people the pollsters contact (think of 1 or 2 or at best 6%), and what is an ignorable miss and what is not changes all the time as politics creates new divides and buries old ones.
Finally, the errors of the polls are just too big for as reliable a prediction about a typical election as the audience apparently expects. Suppose that complex sample design and weighting makes your poll’s margin of error re Biden’s vote share ±6 percent. His lead over Trump will then have a ±12 percent margin of error. Democracy tends to generate competitive elections, so a poll with that error is just dust in the wind. We can average many polls, and then vastly reduce the random error, get a more fine-grained picture of the trends across time and space, and obtain a far more confident forecast of… what the true polling average may be.
But the polling average almost never matches exactly the election results. Analyses of thousands of surveys across hundreds of elections across America and the whole world show that polls have a non-negligible systematic error. The size depends on the type of election we talk about, but in a US presidential election in our times the polling average is off by about 2%. That there is such a systematic error is an inevitable consequence of low response rates and the consequently complex sample designs. Moreover, the systematic error will likely be bigger than 2% when turnout, voter alignments, or something else in politics changes a big way (e.g., many voters switch to postal or early voting). In fact, the 2016 debacle was predicted two years ahead with exactly this argument.
The good news is that it is unpredictable in advance whether the next error will be in a pro-Republican or a pro-Democratic direction. (If it were predictable with confidence and precision, at least some pollsters would correct for it.) Moreover, in spite of declining response rates, polling averages are as good (or as bad, if you like) for predicting elections as they have ever been. Questionnaire surveys are not replaceable as a means of seeing what candidates, policies, and what framing of an issue people like more and less. Campaigns need them, and election forecasts will need them too, at least in the foreseeable future. It is their interpretation that is so much more difficult and uncertain than what the audience was told for too long, and this interpretation cannot be left in the hands of the pollsters alone. If you go back to read this or this prediction about the outcome of this year’s election—and the sources that I am referring to cannot be more mainstream than that—, you will see both that polls are still useful for prediction, and that we can avoid being badly misled by them if we read the right sources and pay attention.